
Fills first
Closed trades, side, duration, and result stay easy to scan. Your log is a timeline of outcomes you can audit against your rules, not a diary of how the session felt.

Take the trade. Log the trade. See the trade. Tessera's trade log is a clear record of what you took (fills, context, and optional notes), built to feed review, statistics, and workspace work without ceremony.
Trade logging should be fast enough that you actually keep it up. Capture the trades you took, show them clearly, and keep the detail you need to review later, not a second process that competes with doing the work.
On each trade you can attach a market snapshot and write a short note. That is the core loop. The same history then powers chart review, statistics, and the reports and simulations you run in workspace.
Some journals are built for mood tags and reflection prompts. Tessera is built for execution and market context: what was traded, under what conditions, and with what result. For an automated strategy that is what matters, and for manual trades, optional notes keep the setup on record. If you need a feelings worksheet first, other tools do that better.
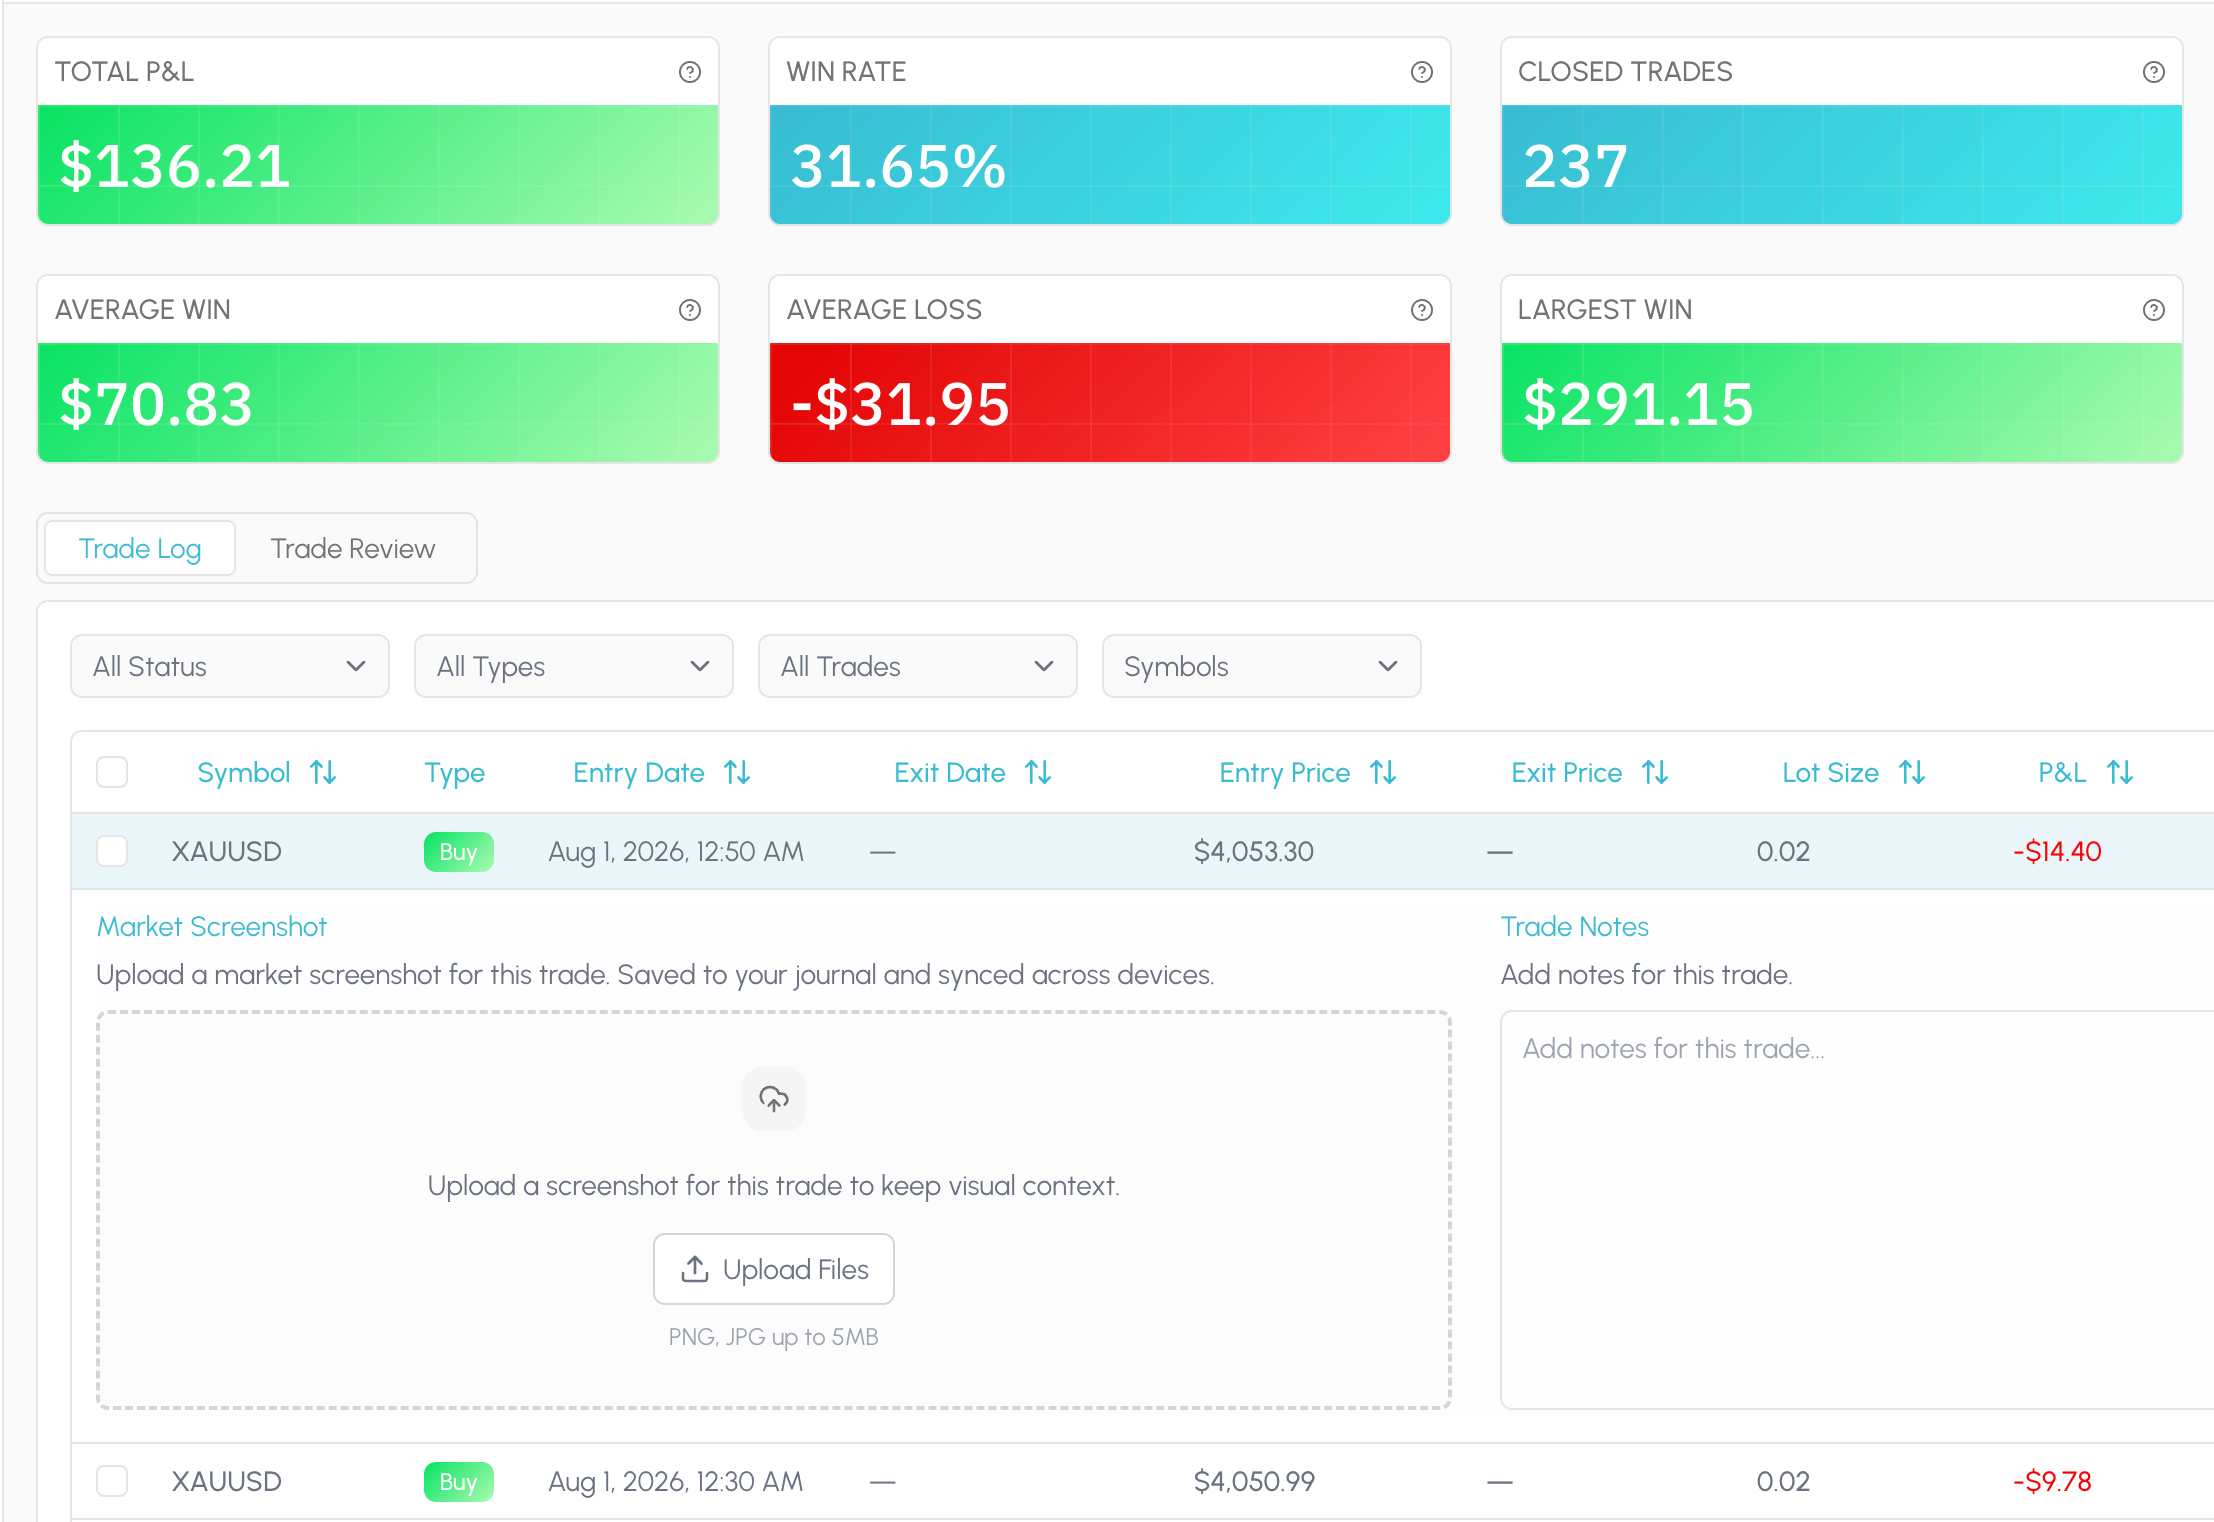
Capture, label, and review trades with the fields that connect to statistics and workspace, without a long journal ritual.
Closed trades, side, duration, and result stay easy to scan. Your log is a timeline of outcomes you can audit against your rules, not a diary of how the session felt.
Attach a market snapshot so the chart state at the trade is still there when you review weeks later. Regime and conditions travel with the fill instead of living in your memory.
Optional notes hold the setup, the miss, or the rule you broke. No required checklists. Write what will matter the next time you open the trade.
Supported brokers connect straight into Tessera. Sync with a click and see your latest trades inside the log, no spreadsheet gymnastics required.








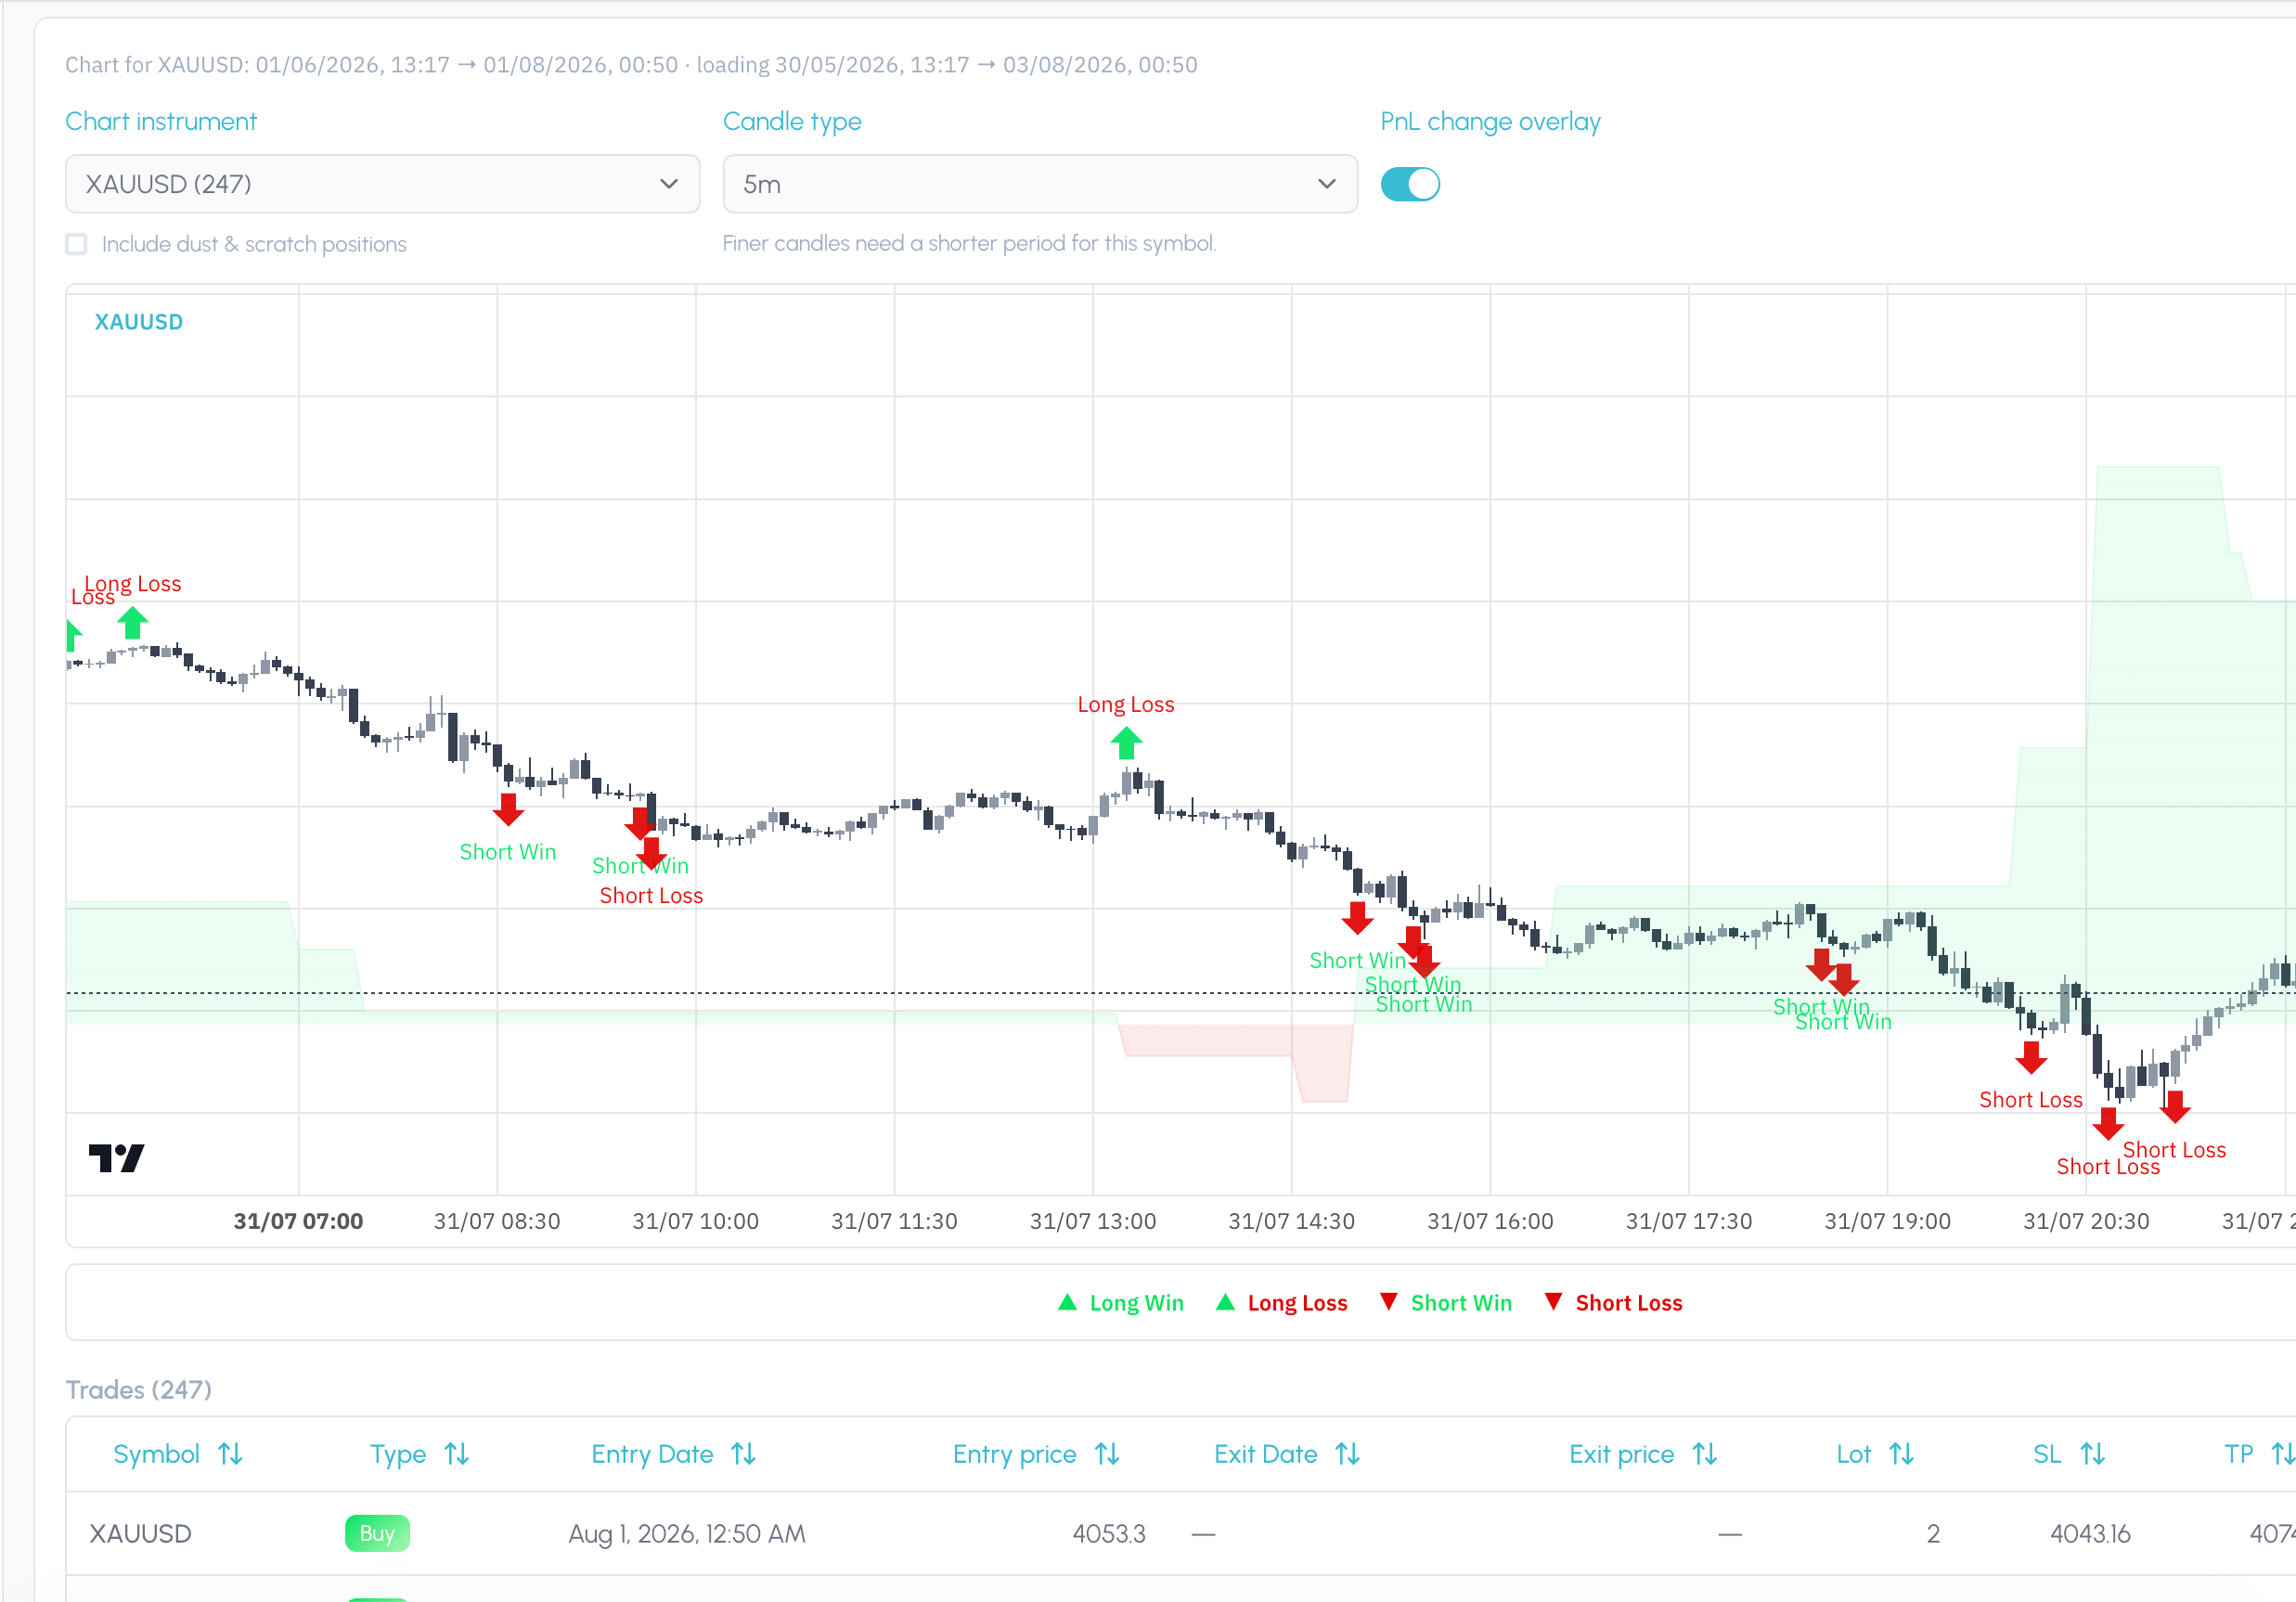
Trade review is about seeing fills on the candles and price action that actually happened: the market as it was, not a reconstructed story after the fact.
Read the trade itself: type, how long it ran, and the regime the market was in when you took it. Move across instruments and timeframes without leaving the chart.
A PnL overlay tracks how your result moved across the date range you are looking at. The trade, the conditions, and the outcome stay on one screen.
Sync brokers, keep a durable record, and review on the chart, then use the same history in statistics, reports, and workspace.