
One place
Overview, detailed cuts, risk, time, symbol and session under the same Statistics home, not five different apps.

Statistics is your always-on dashboard of standard metrics from the trades you import or log. Reports is where you configure a specific question (performance, regime, exit placement) and dig in as part of a workflow.
Performance, risk, time, and breakdowns: the measures traders scan when they check how a period went.
Standard performance numbers belong in one home so you can open a period, scan the view you need, and move on, without bouncing between tools or rebuilding a sheet.
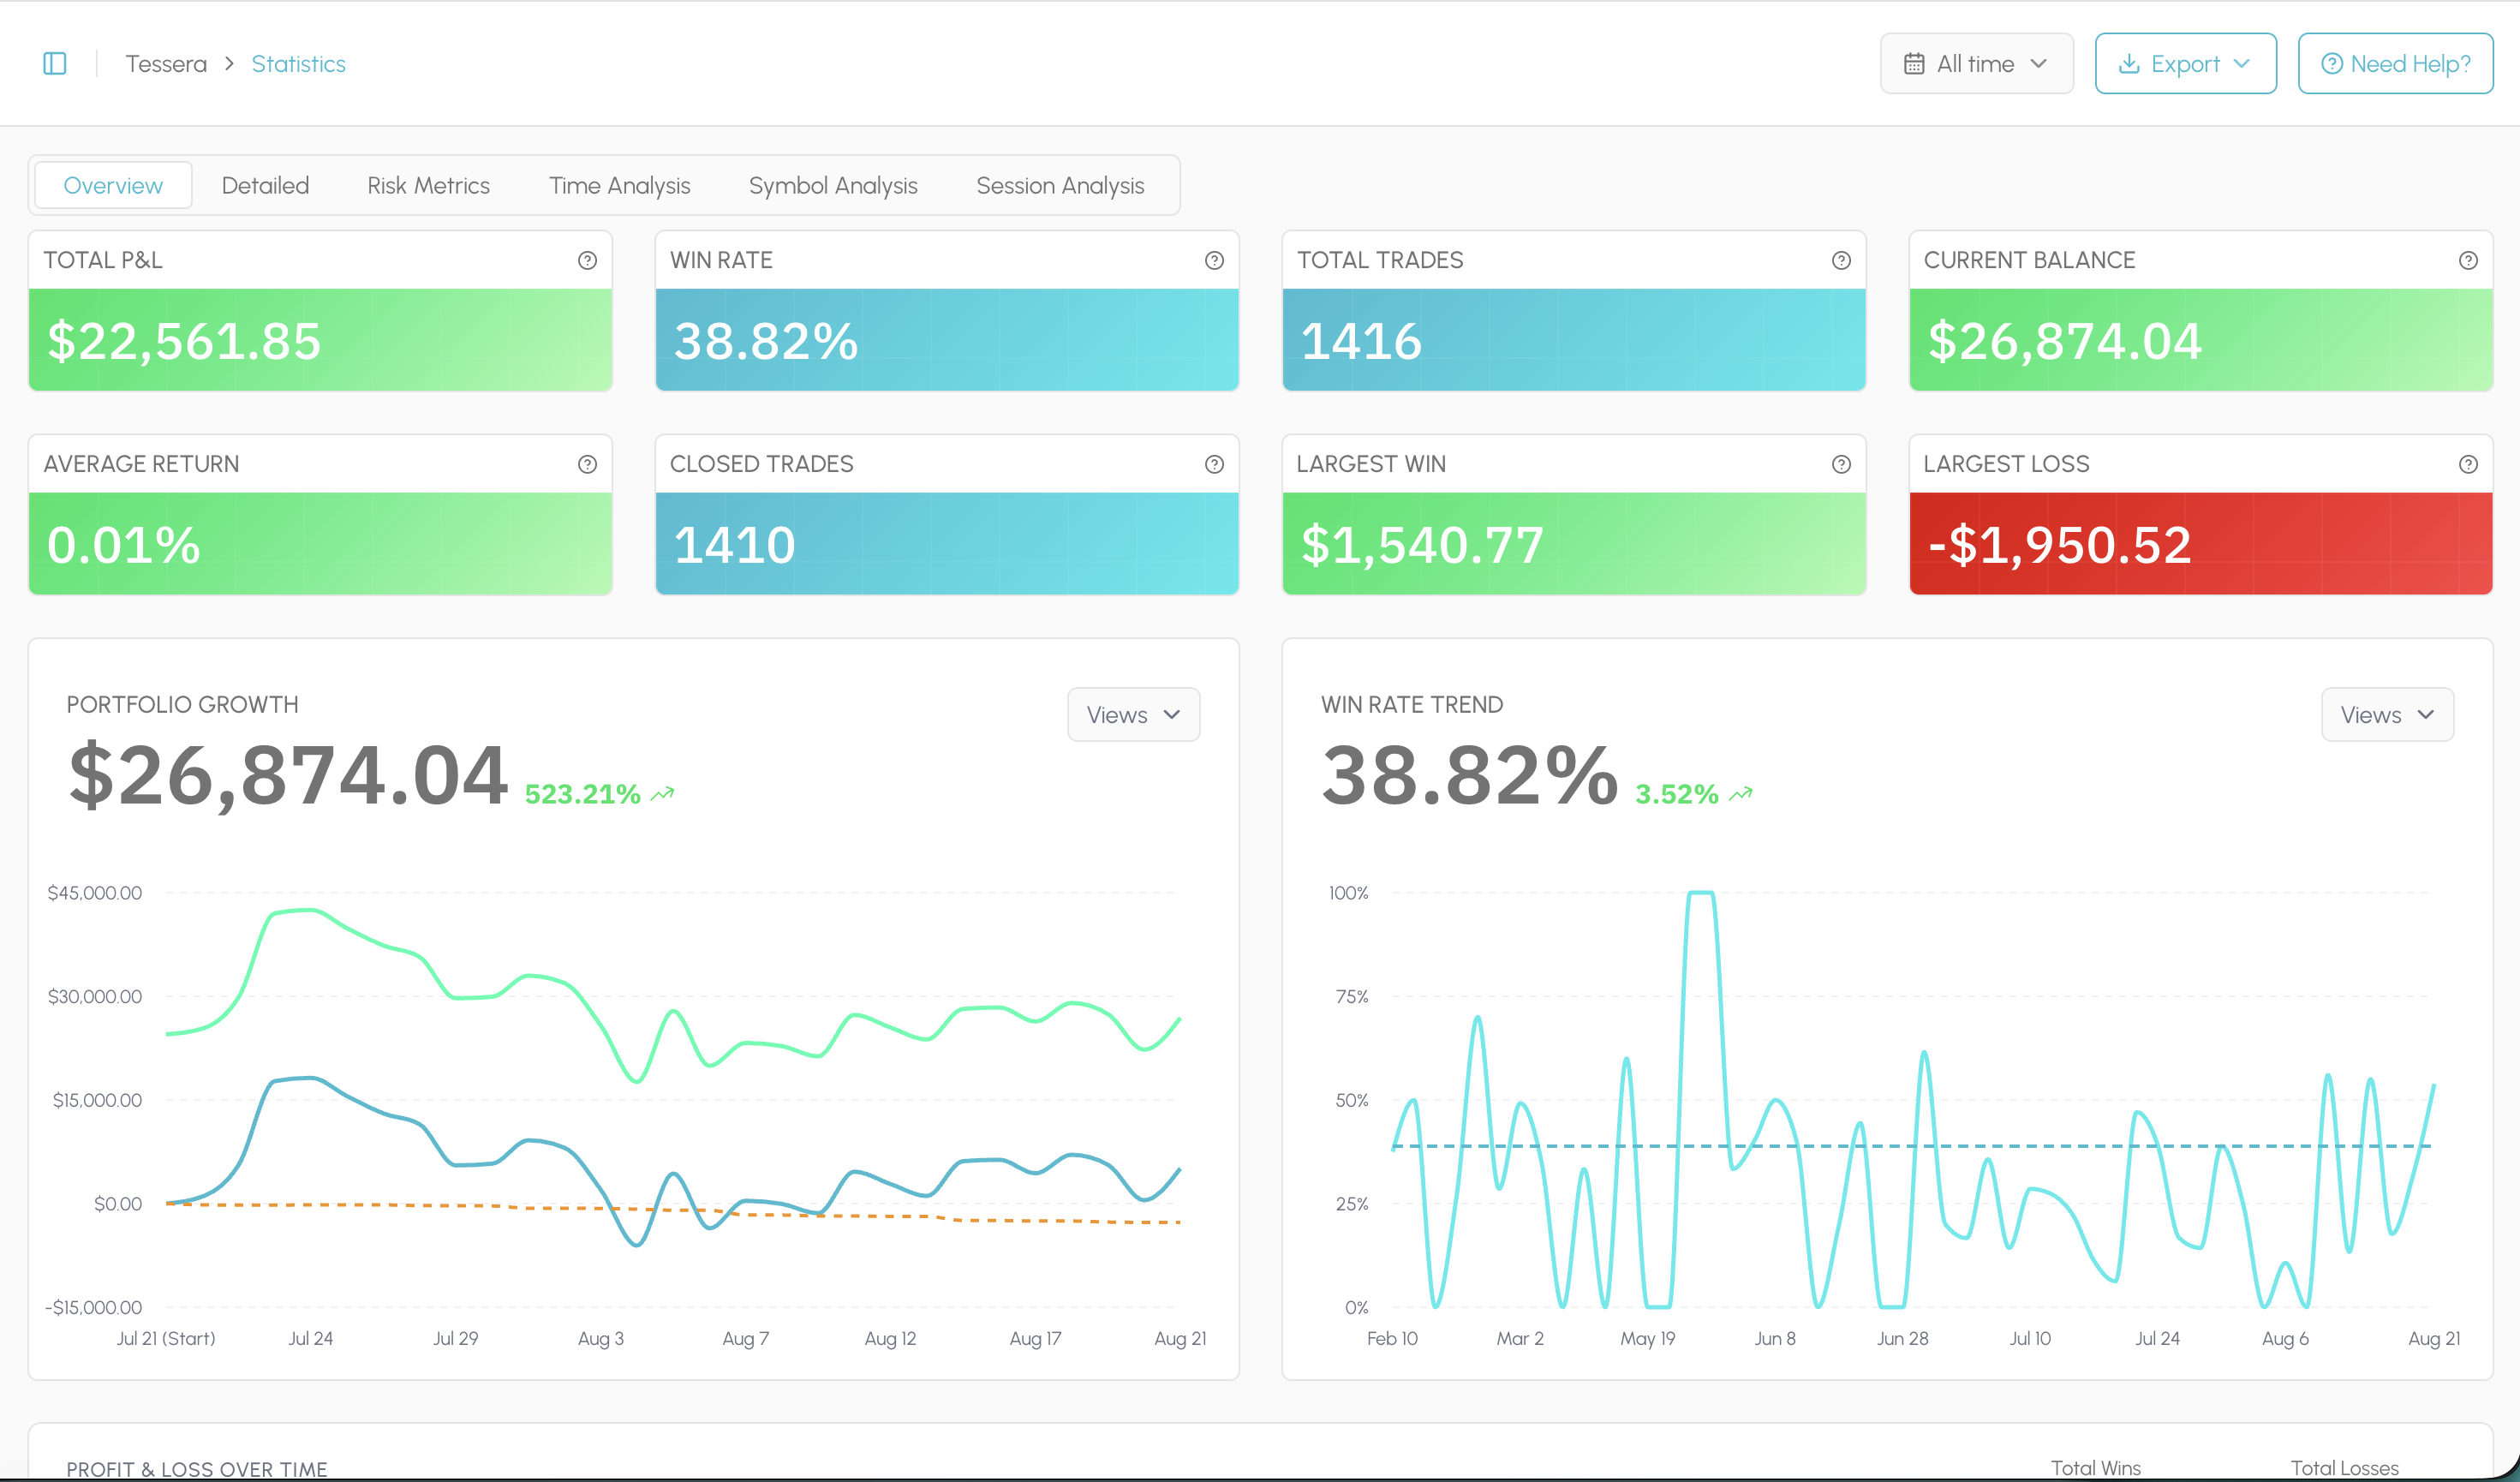
Overview, detailed cuts, risk, time, symbol and session under the same Statistics home, not five different apps.
Clear tabs and layout so you can get to the view you want and the number you came for without hunting.
Each view is built for a job: the period read, risk, time, and breakdowns. Same trades, ordered for how you actually check work.
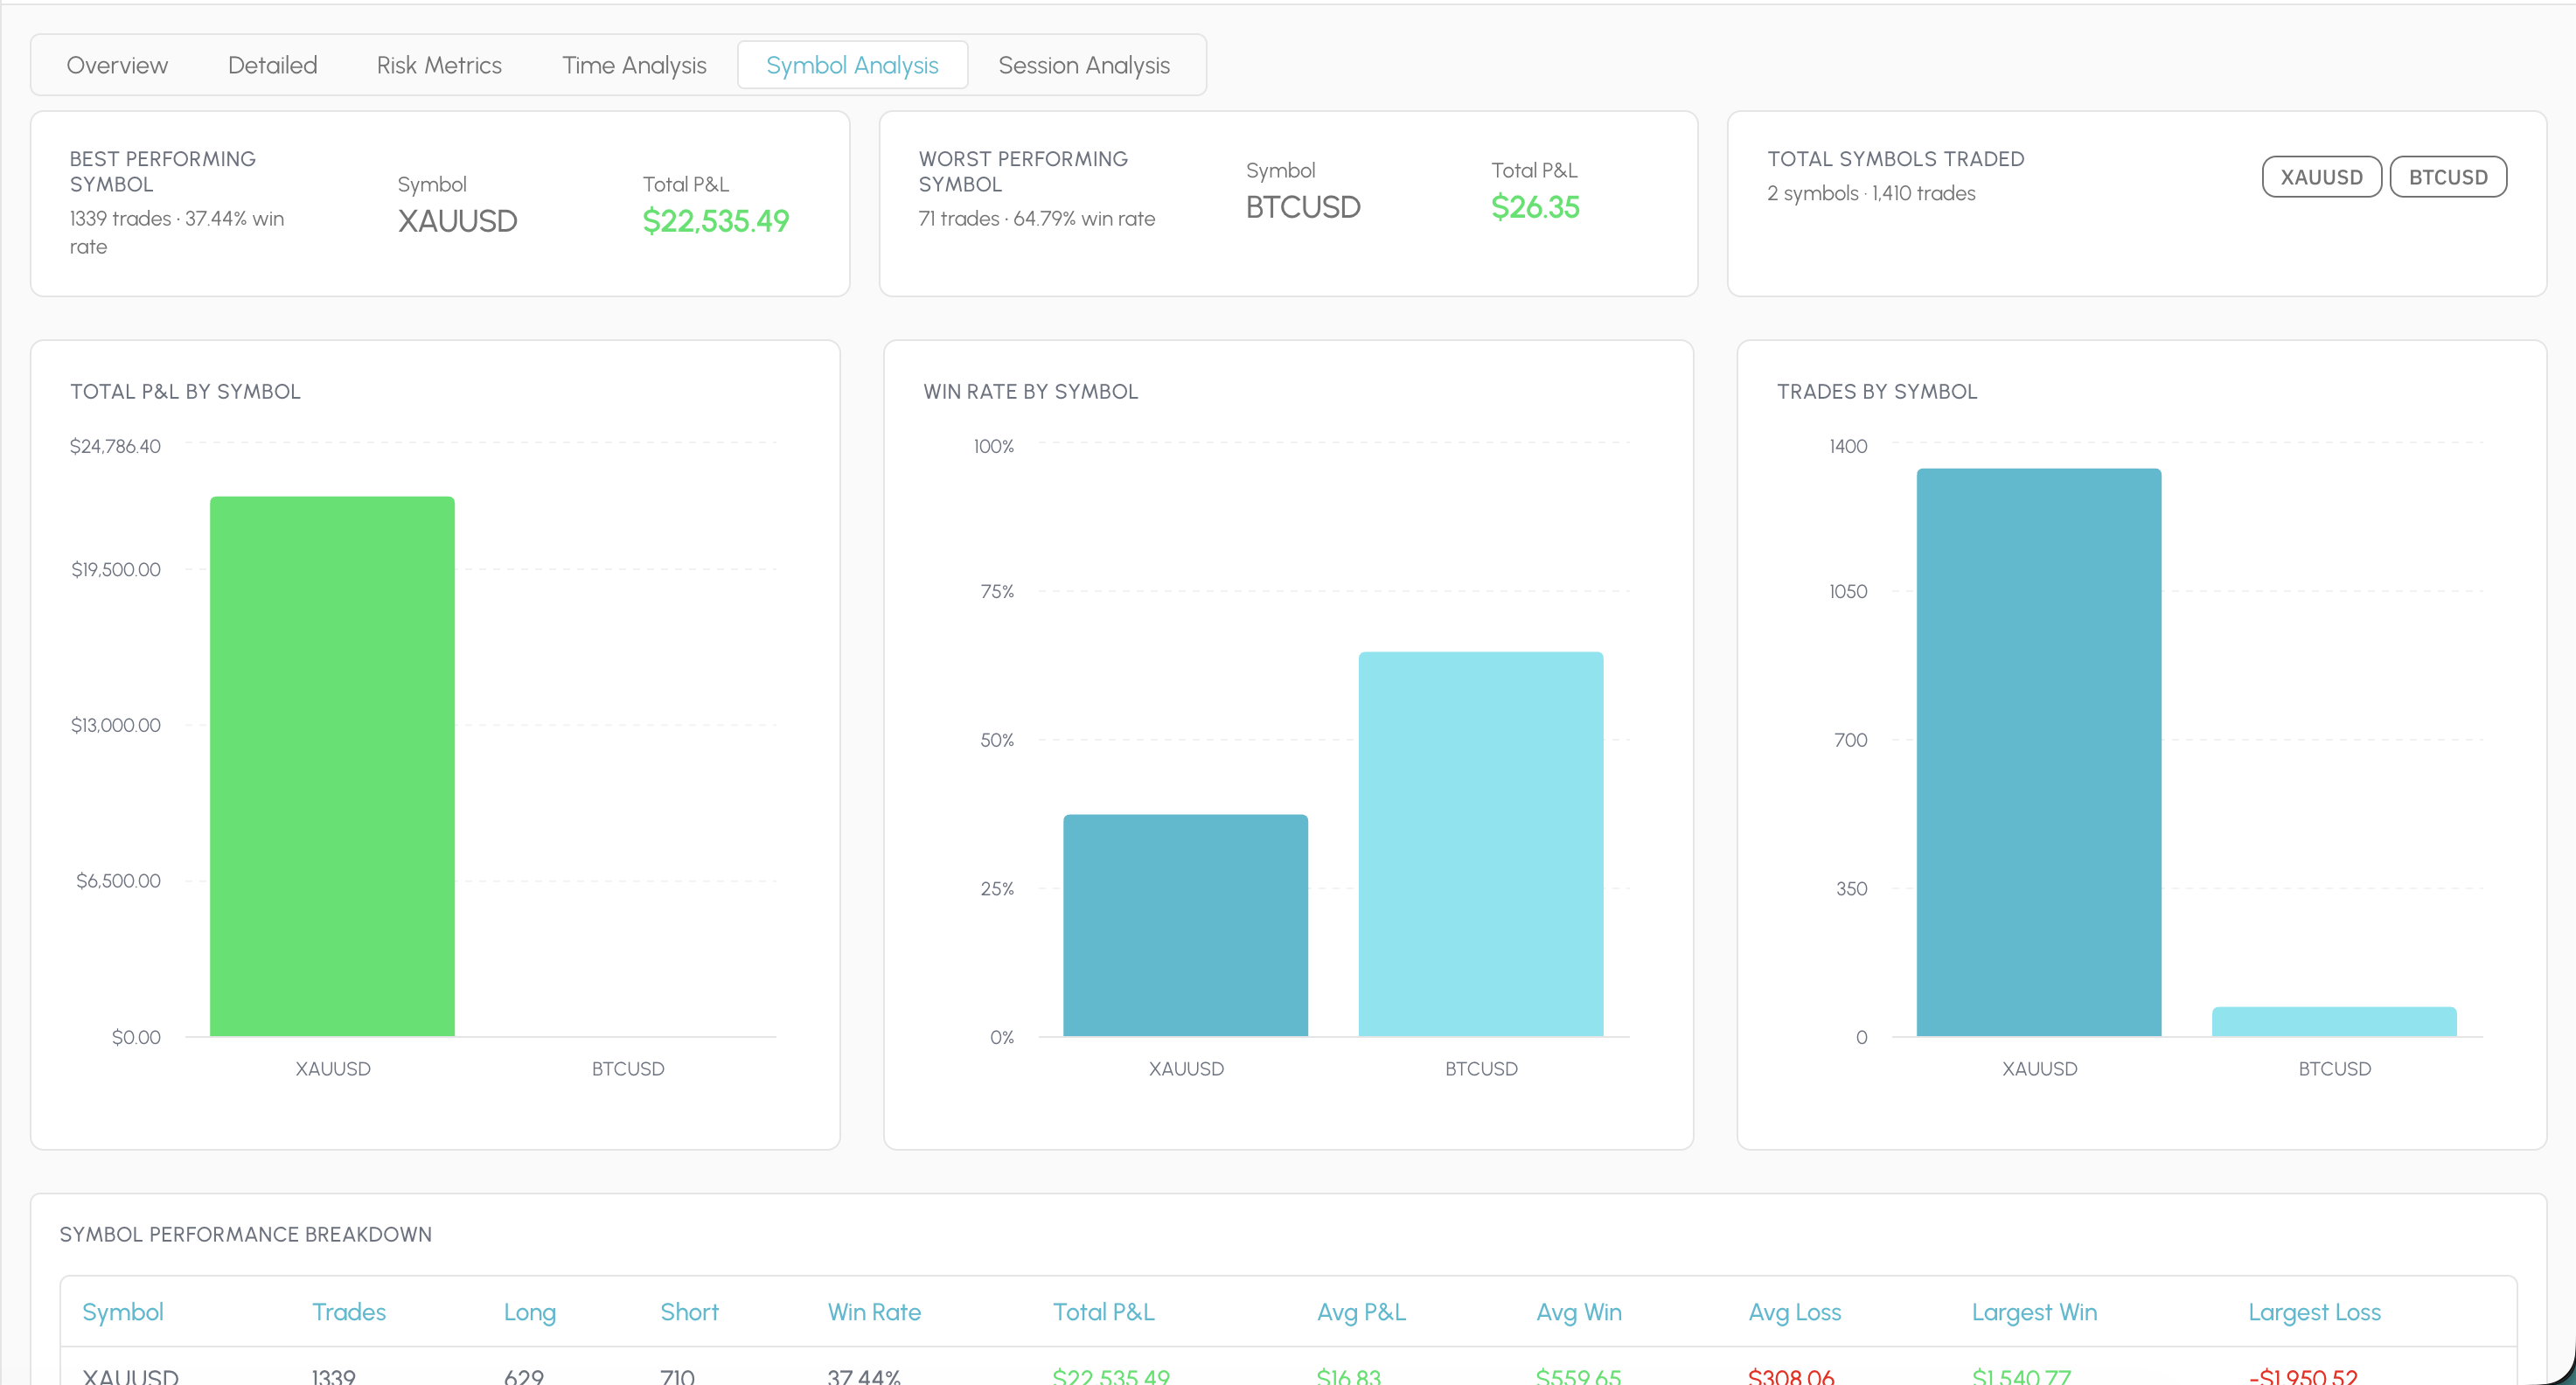
Symbol analysis ranks instruments by performance for the period you select. You get best and worst symbols, P&L and win rate by market, trade counts, and a full table with long and short split, averages, and extremes.
Use it when the overall book looks fine but you still need to know which markets are carrying results and which ones are not.
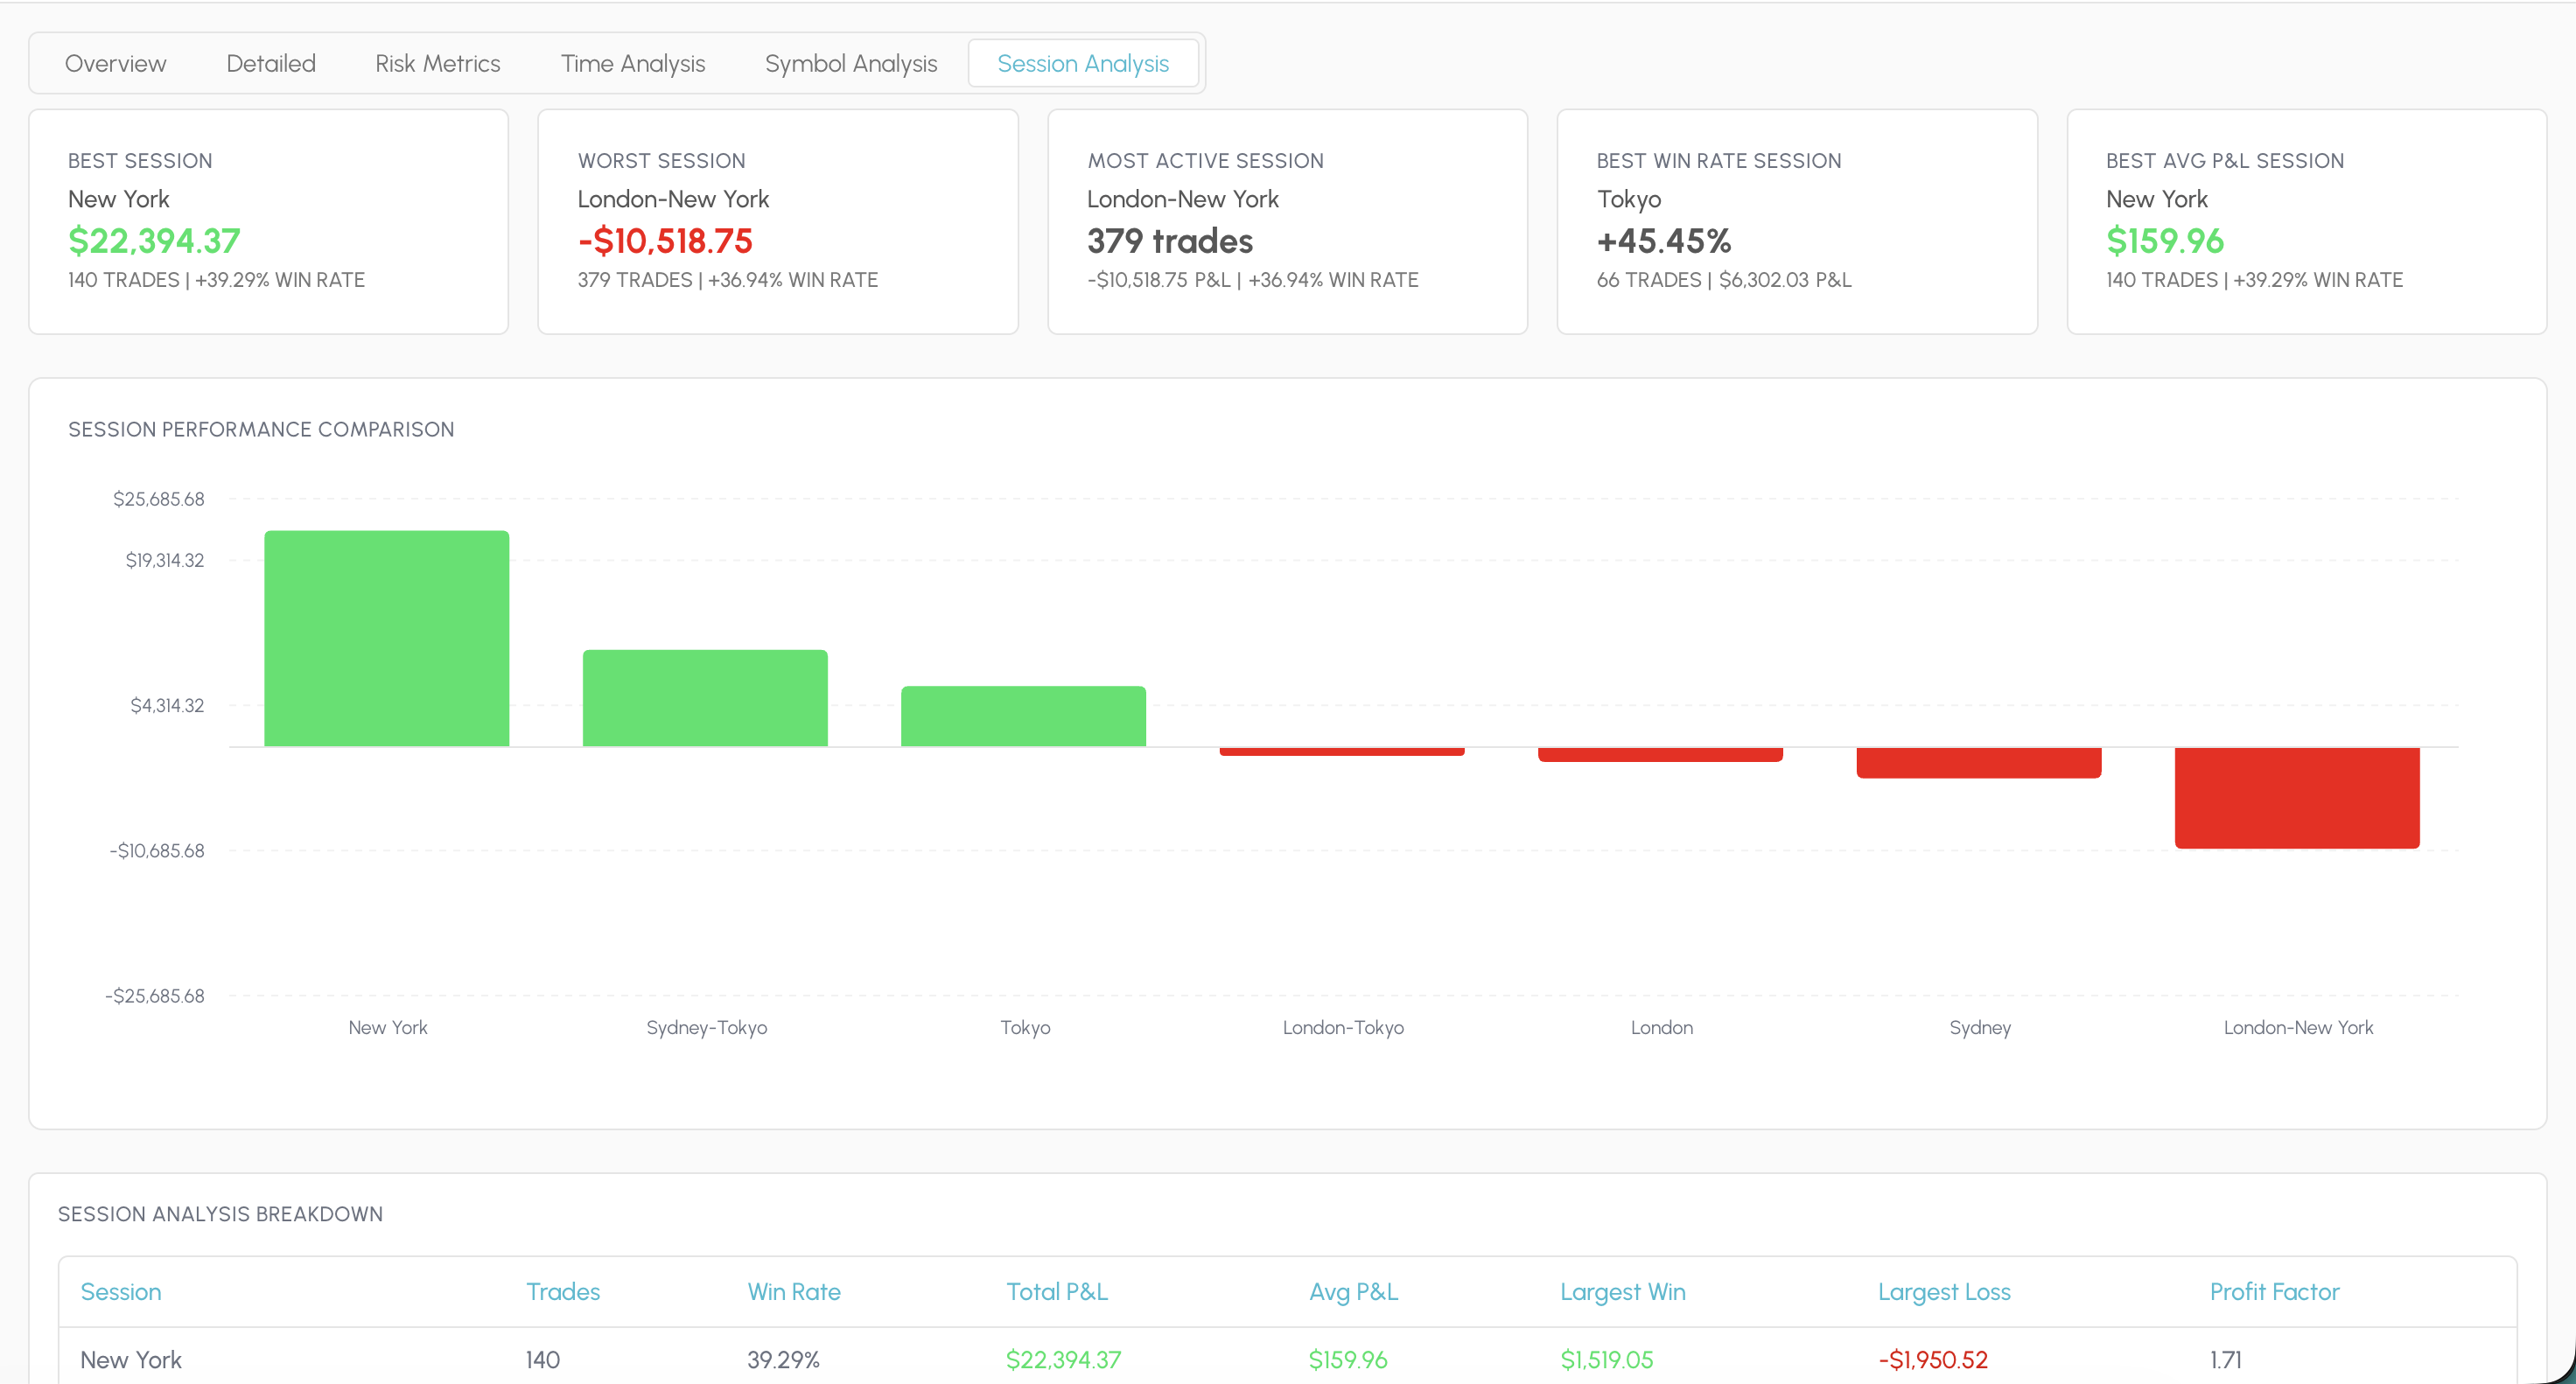
Session analysis groups the same closed trades by trading session. You see best and worst sessions, activity by session, win rate, total and average P&L, and a breakdown of every session window in the table.
Useful when results depend on time of day as much as the setup, so you can tell which sessions help and which ones hurt.
Unlike some other software, we will not squash everything into a single made-up score. Those grades usually measure how close you are to someone else’s ideal profile, not whether your trading is working.
We keep the real metrics and get out of the way. You decide which ones matter for your style.
Sign up and open Statistics on the trades you already log. The numbers you care about, organised so they are quick to use.